Skip to content
Case study · 02 / 09← All work

Reality Graph

An interactive map of matter: elements, compounds, materials and inventions, and how they connect.
Role
Personal project: designed and built end to end
Stack
React 19, TypeScript, Zustand, D3, React Three Fiber, GSAP
Periodic table
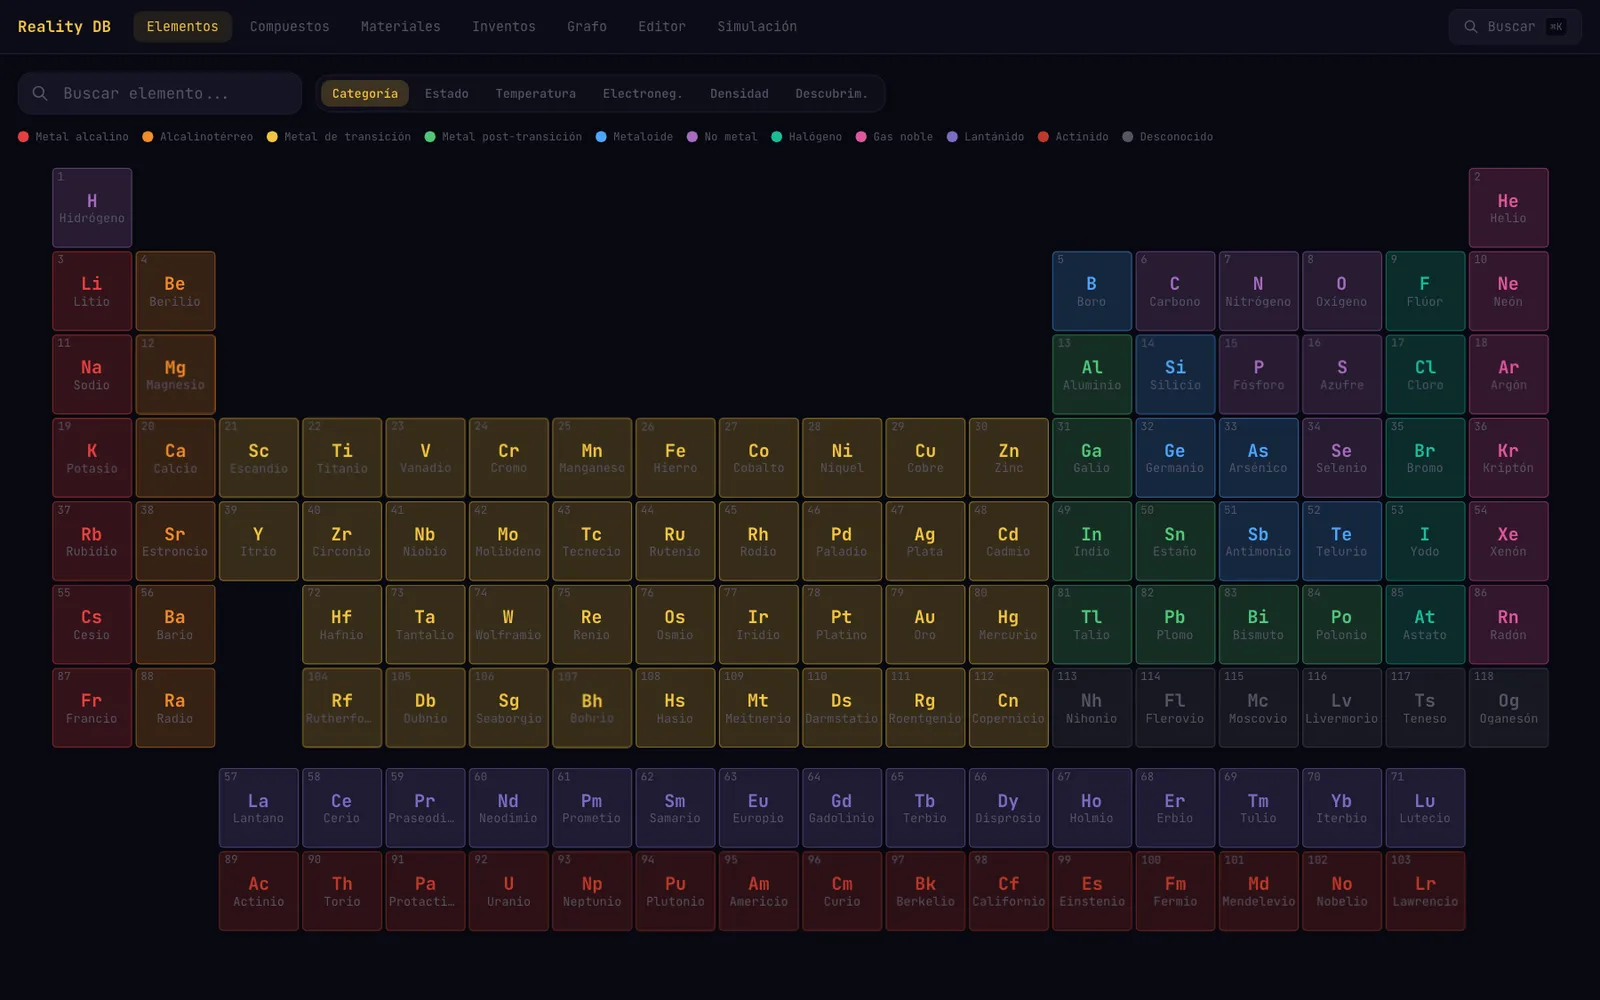
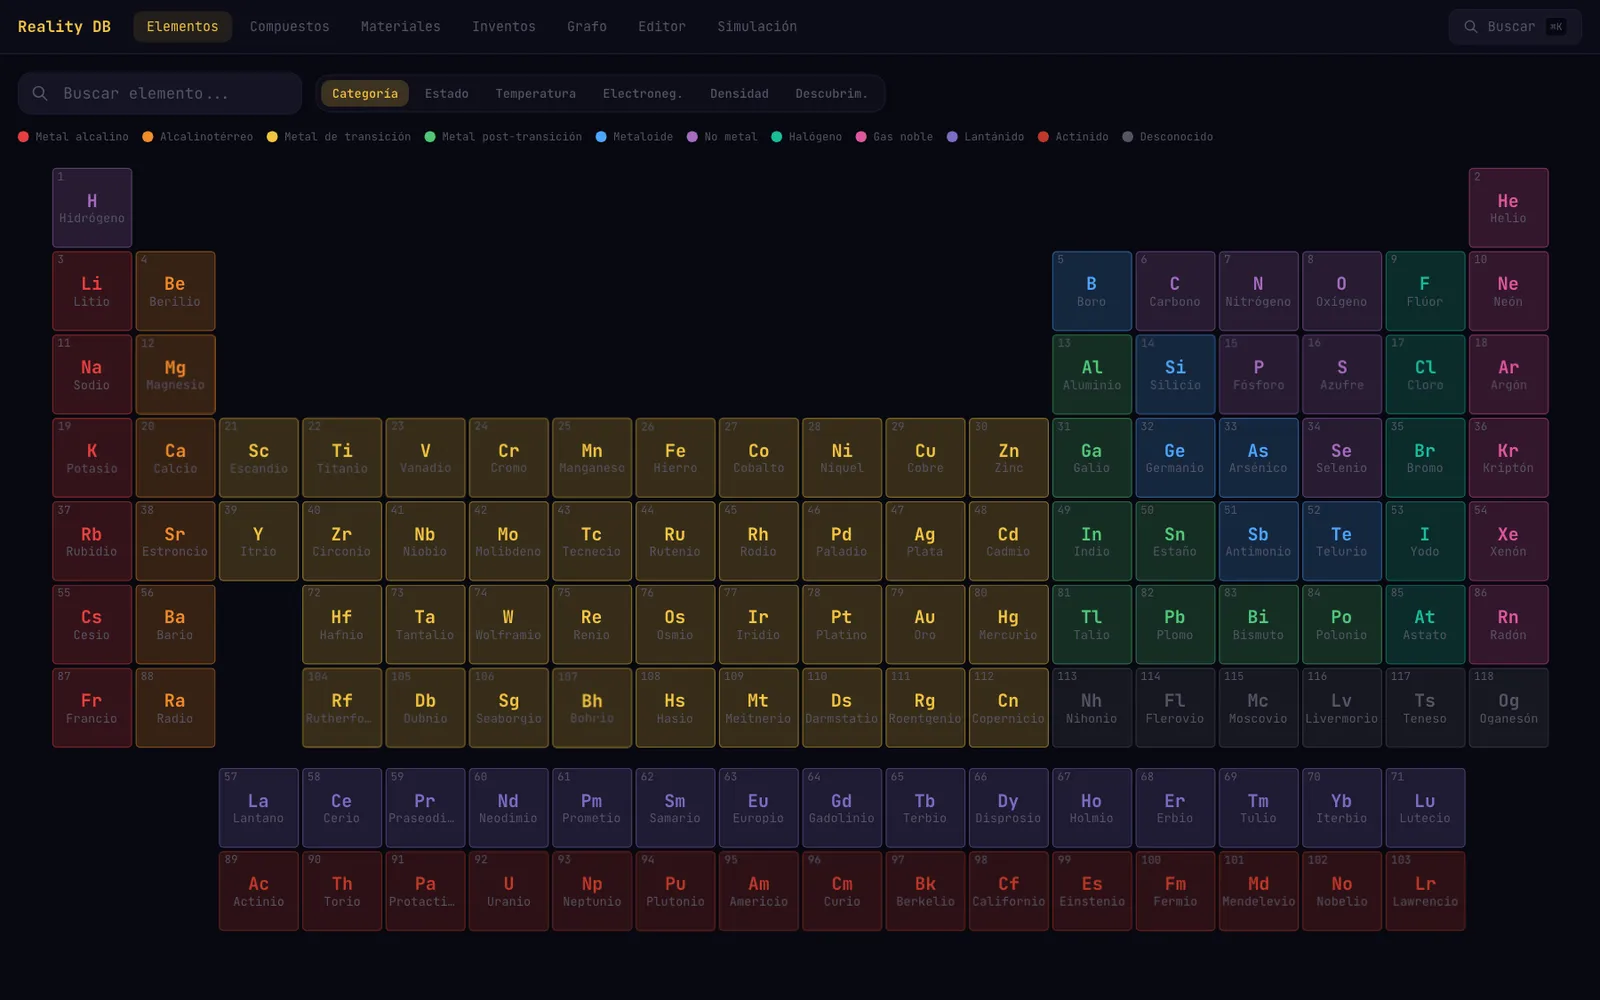
Periodic tableGraph edges are derived from the data, not stored
(01) The problem

A periodic table shows elements one by one. It does not show that iron ends up in steel, and steel in a steam locomotive. I wanted one place to browse those links. It also had to let you build a molecule and test a reaction.

My roleI designed the data model and the interface, and wrote all the code.
(02) ResultsCounted in the code
118elements in the periodic table
351entities in the relationship graph
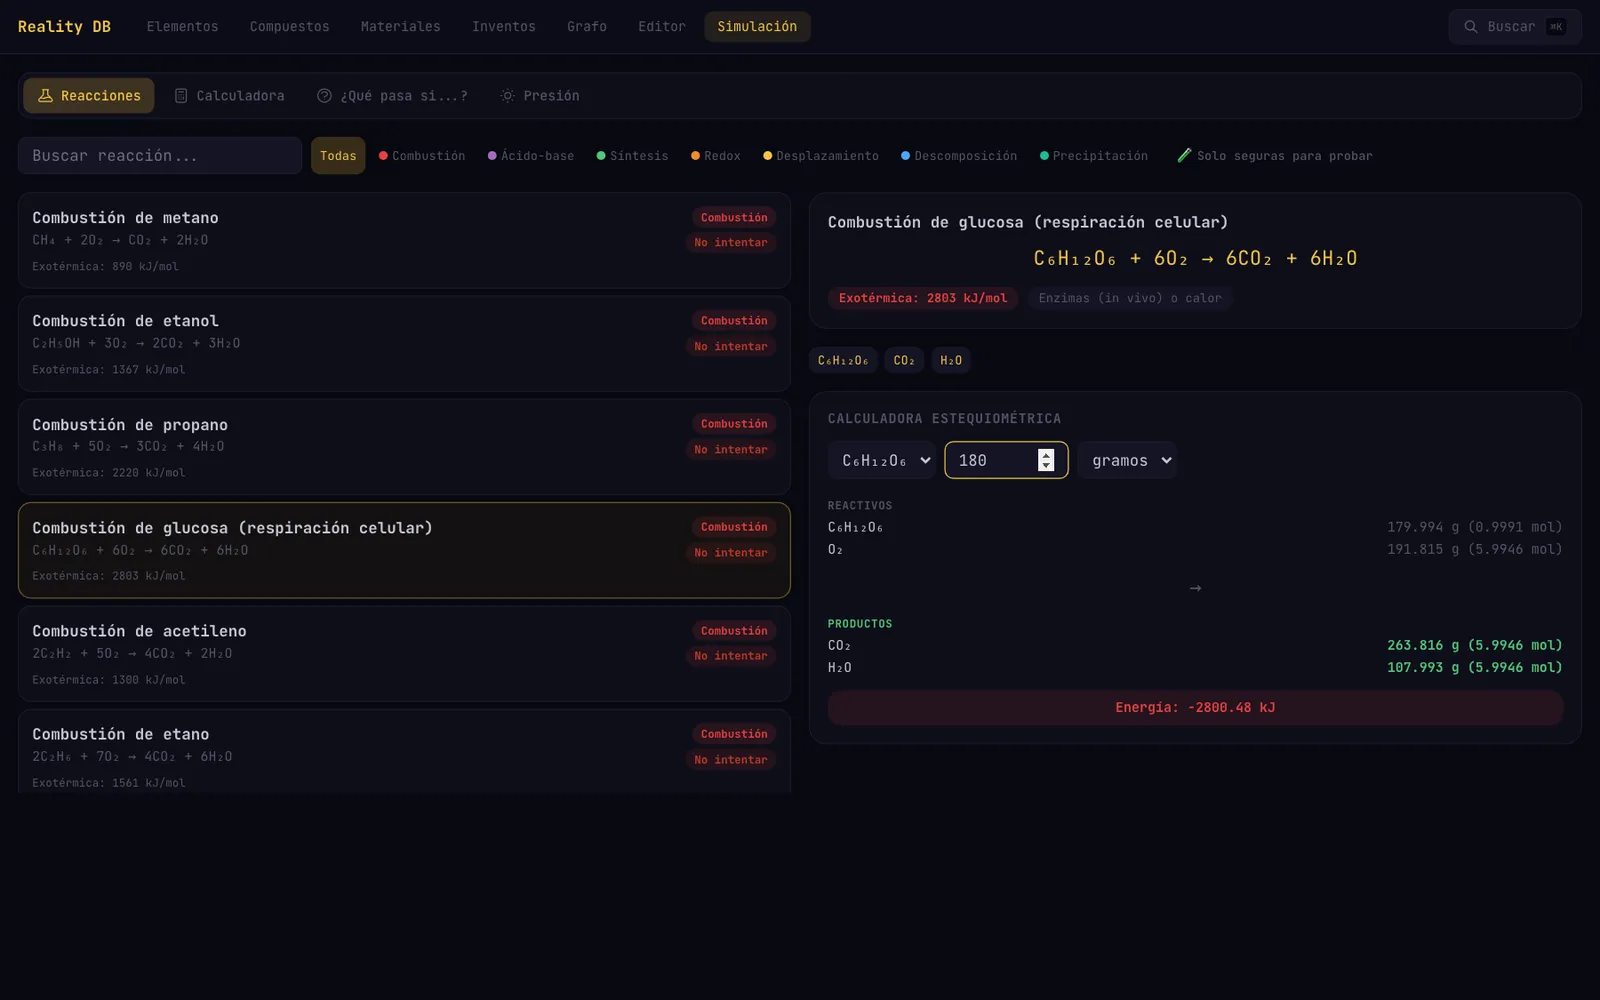
4simulators: reactions, stoichiometry, what-if and pressure
(03) Architecture

Three decisions that shaped it.

  1. 01

    Graph edges are derived from the data, not stored

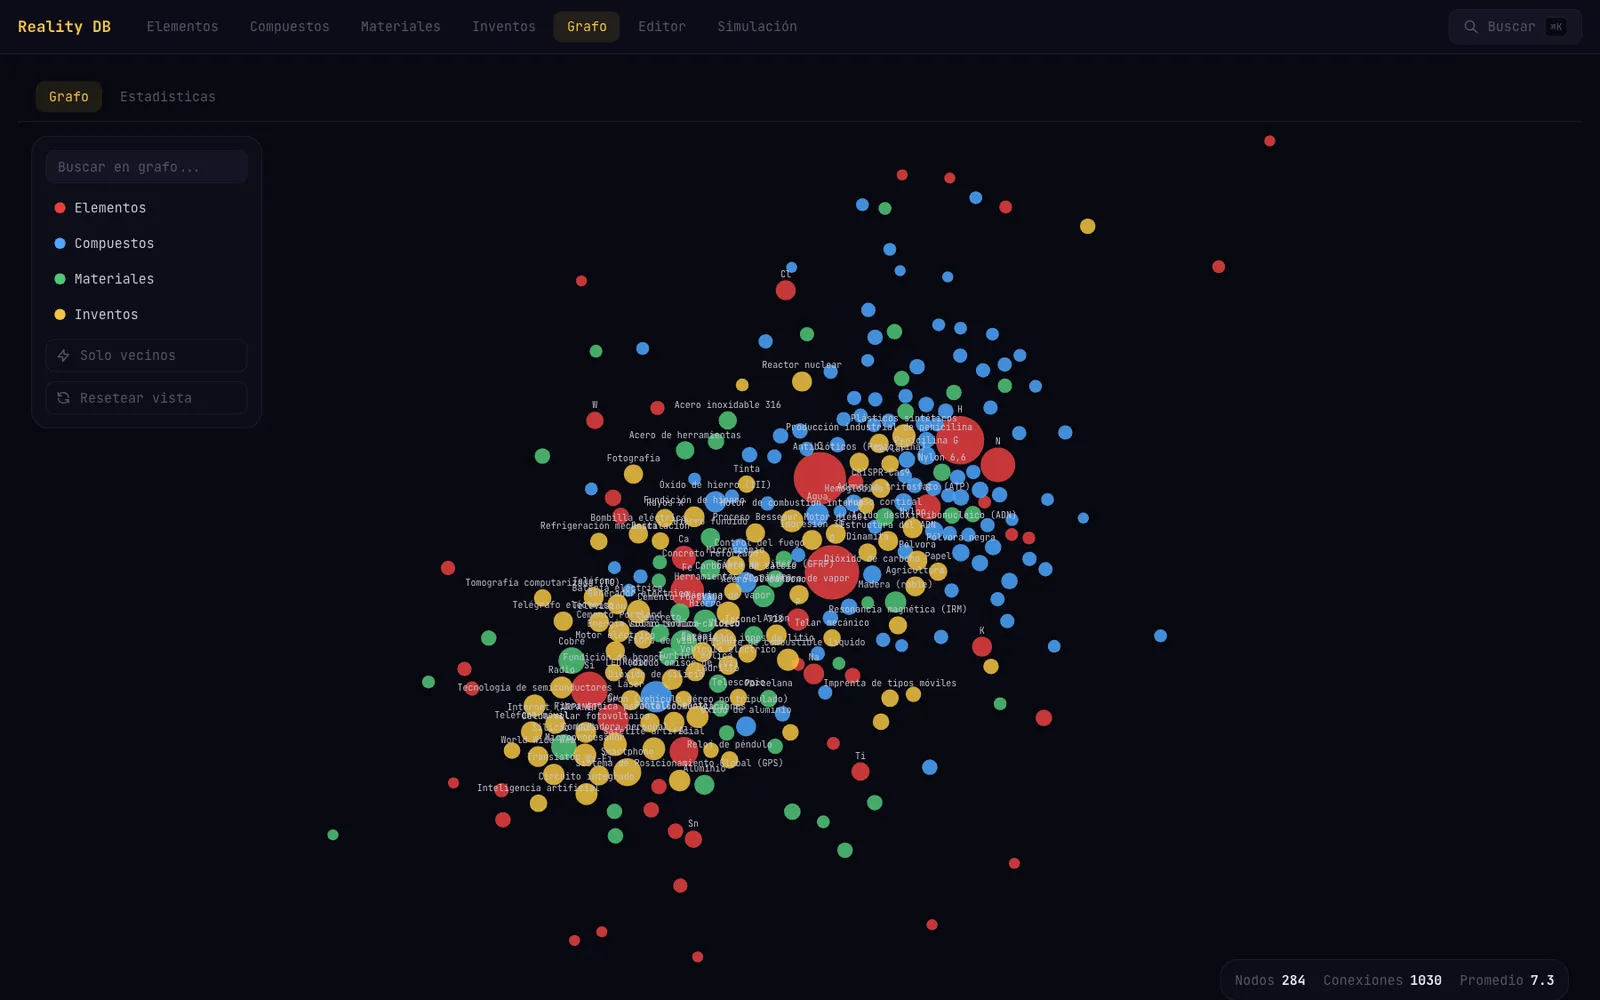
    Why. A compound lists its elements and an invention lists its prerequisites. The graph is built from those fields, so adding an entity adds its links.

    Trade-off. Only links that fit a field exist. The whole graph is computed when the module loads.

  2. 02

    D3 owns the SVG, React owns the filters

    Why. The force simulation, zoom and labels run in D3 inside one effect. Filters live in a Zustand store and decide which nodes reach it.

    Trade-off. Any filter change tears down the SVG and restarts the simulation, so the layout jumps.

  3. 03

    Snapshot undo in the editor, saved molecules in IndexedDB

    Why. Each edit pushes a copy of atoms and bonds, capped at 50 steps. Dexie keeps saved molecules across sessions without a server.

    Trade-off. Snapshots copy the full molecule on every step. Saved molecules stay in that one browser.
(04) GalleryKeep scrolling →
Periodic table
Periodic table · Six color modes, from category to discovery year. Every element opens its own detail page.
Relationship graph
Relationship graph · A D3 force layout with type filters, a neighbors-only mode and click-through to each entity.
Molecule editor
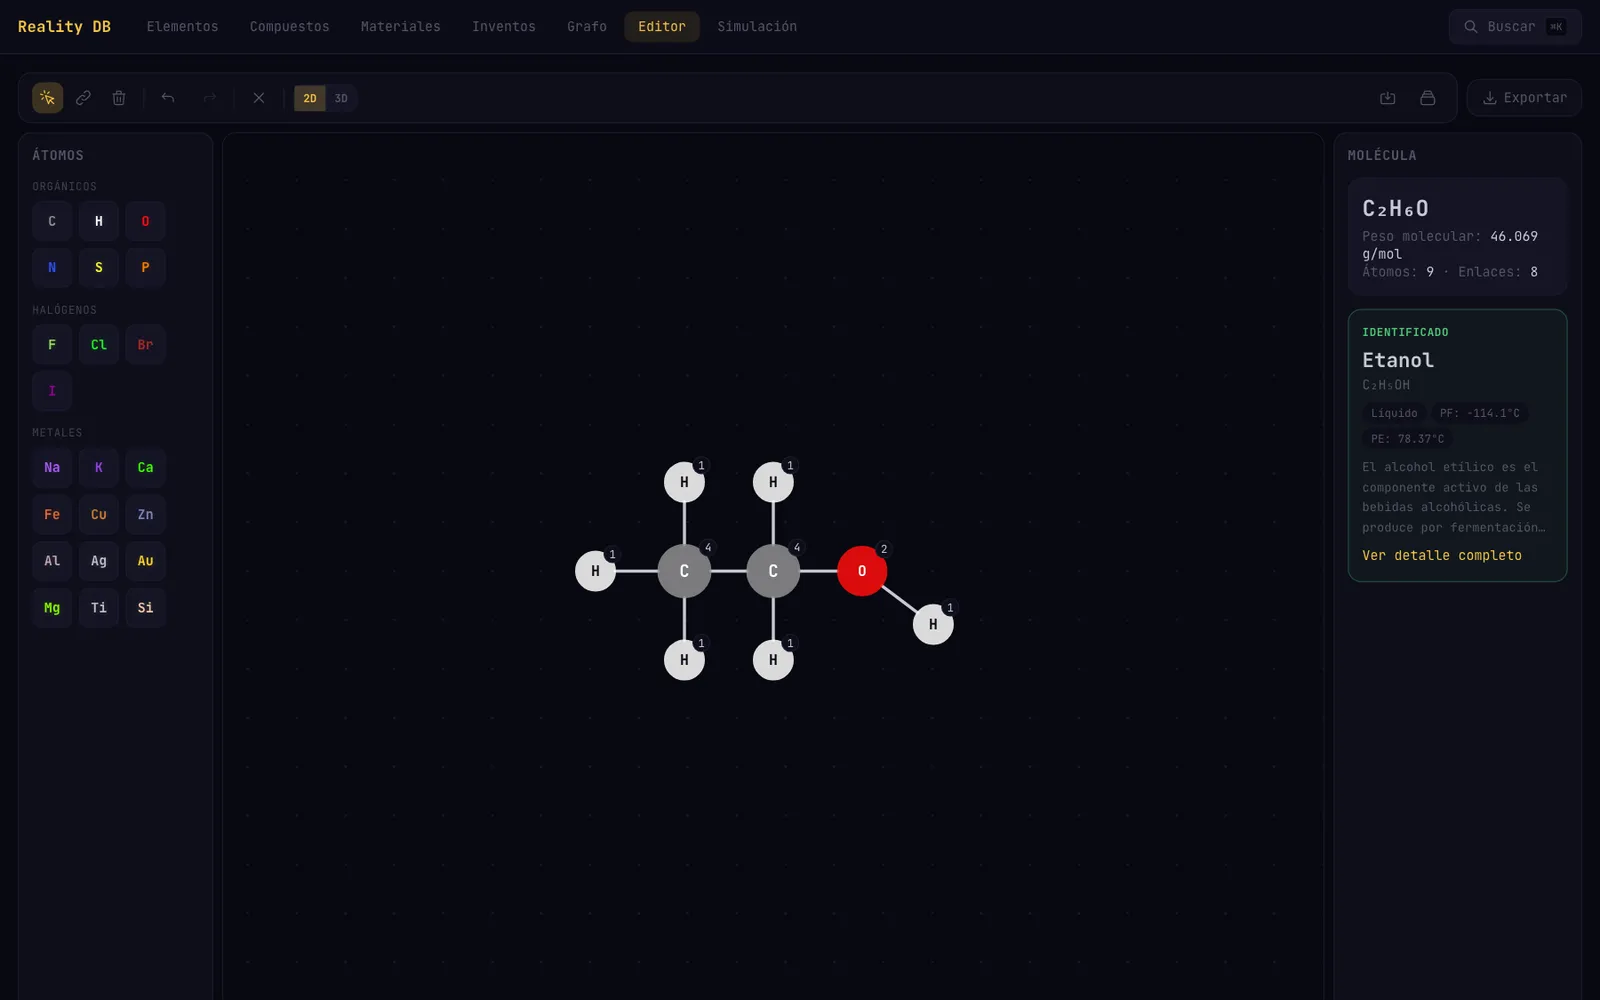
Molecule editor · Drop atoms, draw bonds, and the editor matches the formula against the compound list.
Simulators
Simulators · Reactions, a stoichiometry calculator, a what-if explorer and a pressure simulator.
(05) What I'd do next
01Use bonds when identifying a molecule. Today it matches only the Hill formula, so isomers look the same.
02Give the 3D view real geometry. It now places atoms on a flat plane using the 2D editor coordinates.
03Keep the D3 simulation alive across filter changes and update nodes in place, so the layout stays stable.
Next project · 03 / 09
Nexora →A white-label real-estate CRM for Liliana Cappelli
Case study · 02 / 09

Reality Graph

An interactive map of matter: elements, compounds, materials and inventions, and how they connect.

Role
Personal project: designed and built end to end
Stack
React 19, TypeScript, Zustand, D3, React Three Fiber, GSAP
Reality Graph
(01) The problem

A periodic table shows elements one by one. It does not show that iron ends up in steel, and steel in a steam locomotive. I wanted one place to browse those links. It also had to let you build a molecule and test a reaction.

My roleI designed the data model and the interface, and wrote all the code.
(02) Results
118elements in the periodic table
351entities in the relationship graph
4simulators: reactions, stoichiometry, what-if and pressure
(03) Architecture

Three decisions that shaped it.

01

Graph edges are derived from the data, not stored

Why. A compound lists its elements and an invention lists its prerequisites. The graph is built from those fields, so adding an entity adds its links.

Trade-off. Only links that fit a field exist. The whole graph is computed when the module loads.

02

D3 owns the SVG, React owns the filters

Why. The force simulation, zoom and labels run in D3 inside one effect. Filters live in a Zustand store and decide which nodes reach it.

Trade-off. Any filter change tears down the SVG and restarts the simulation, so the layout jumps.

03

Snapshot undo in the editor, saved molecules in IndexedDB

Why. Each edit pushes a copy of atoms and bonds, capped at 50 steps. Dexie keeps saved molecules across sessions without a server.

Trade-off. Snapshots copy the full molecule on every step. Saved molecules stay in that one browser.
(04) Gallery
Periodic table
Periodic table · Six color modes, from category to discovery year. Every element opens its own detail page.
Relationship graph
Relationship graph · A D3 force layout with type filters, a neighbors-only mode and click-through to each entity.
Molecule editor
Molecule editor · Drop atoms, draw bonds, and the editor matches the formula against the compound list.
Simulators
Simulators · Reactions, a stoichiometry calculator, a what-if explorer and a pressure simulator.
(05) What I'd do next
01Use bonds when identifying a molecule. Today it matches only the Hill formula, so isomers look the same.
02Give the 3D view real geometry. It now places atoms on a flat plane using the 2D editor coordinates.
03Keep the D3 simulation alive across filter changes and update nodes in place, so the layout stays stable.
Next projectNexora →
Nahuel SantillánEN